Outdoor sports – Unified insight for actionable insights to manage supply chain
Getting the Complete Picture with an Online Inventory Dashboard
An outdoor sports and survival gear manufacturer that operates in multiple regional locations around the world. It was having difficulty consolidating inventory data from disparate systems. This made making timely business decisions difficult as the company didn’t have real-time access to data. Think AI created an Online Inventory Dashboard solution using Microsoft Power BI and Azure to provide Sea to Summit with intelligent decision-making insight through the consolidation of regional sales and inventory data for various regional operations.Customer challenges Since the client operates in multiple regional locations including the US, Europe, Australia and the Asia Pacific, they were having difficulty consolidating company data. The US Region was using SAP Business One, the Australia Region was using MYOB and the European and Asia Pacific Regional data were using 3rd Party Managed Warehouse Management Systems. As such, getting the proper business intelligence to make timely decisions was made difficult as they didn’t have real- time access to inventory on-hand by volume and value, inventory turns, and inventory covers. In addition, the fluctuations in currency conversion rates also affects the visibility for profit margins across products with seasonal changes in demands.
Partner solutions Think AI consolidated the various data elements that came from MYOB and SAP Biz One data sources, analyzed the Inventory Dashboard requirements, and using the calculations and transformations required, created an Inventory Dashboard providing all necessary customer insights using Microsoft Power BI and Microsoft Azure.
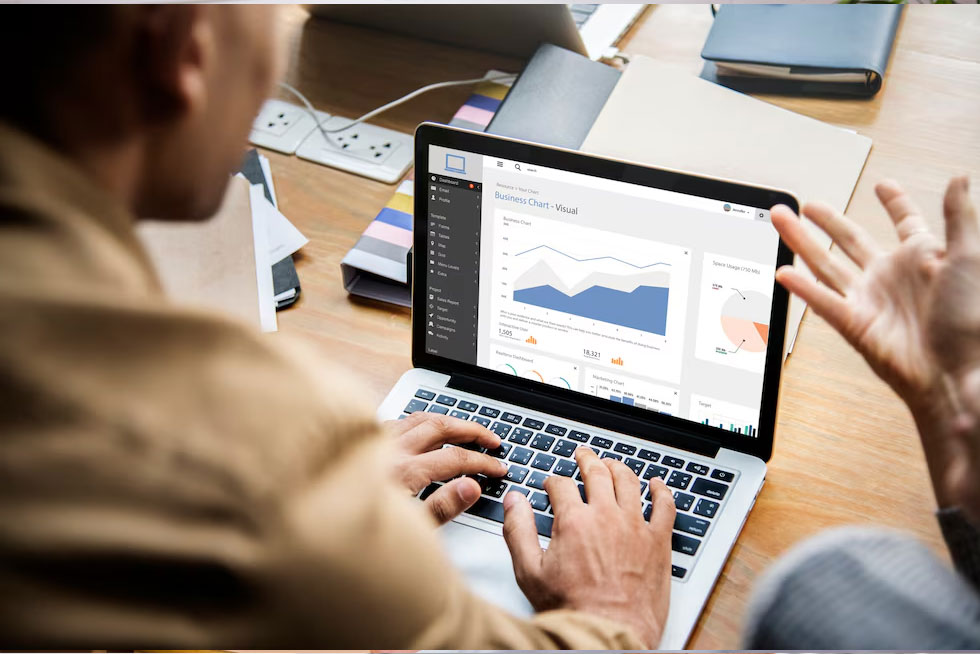
Customer benefits Think AI’s solution provided the customer with a BI Dashboard view that displays inventory on hand by volume and cost and displays a side-by-side bar chart for different regions with supporting details and filters. The dashboard displays inventory turns using categories as a metric and that displays historical data and inventory cover that provides projections by applying growth factors based on the previous year plus calculated percentile increase increments.
- Better insight into product movements and inventory
- Enabled timely intelligent decision making for inventory and manufacturing management
- Real-time visibility on profit margins, and projections for regional operations

