As a manufacturing manager, you know that efficient production is key to profitability and success. However, with so many moving parts, it can be challenging to get a clear picture of your operations. Power BI offers a solution. With its powerful data visualization and analytics capabilities, you can tap into your production data to optimize workflows, identify bottlenecks, and make data-driven decisions.
In this article, you will explore how leading manufacturers are using Power BI to gain actionable insights and drive continuous improvement. You will come away with specific strategies to streamline manufacturing through advanced analytics. The result? Smoother operations, improved productivity, and better financial performance.
Now let’s dive in and see how you can leverage the power of data to take your production to the next level.
The benefits of using Power BI in manufacturing
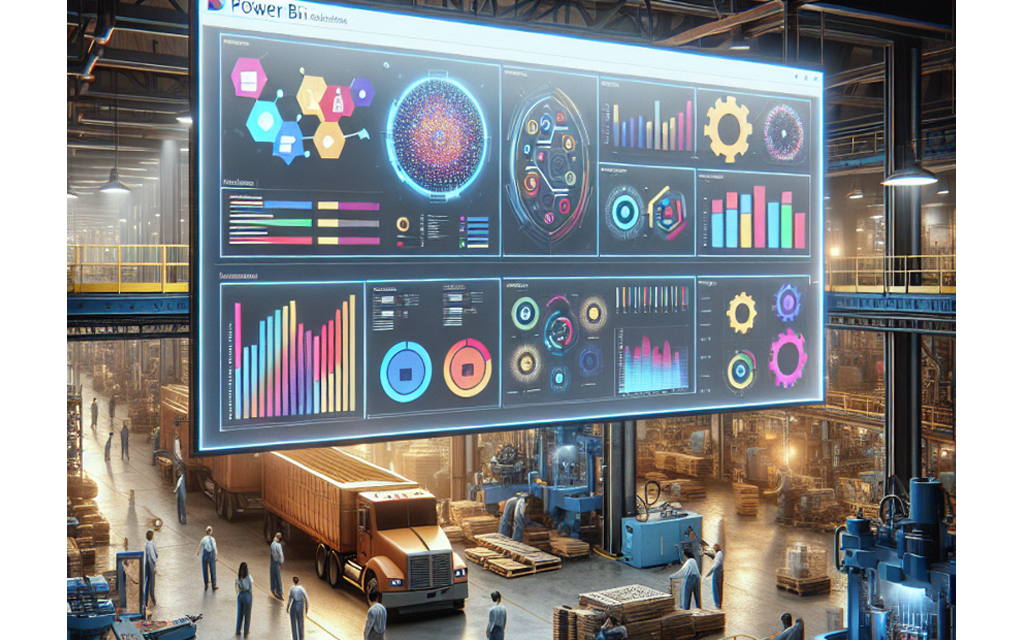
Power BI’s data visualization capabilities provide instant insights into your production processes. Interactive dashboards give you a high-level overview of key metrics like cycle times, throughput, and yield rates across all stages of the production line. You can drill down into specific areas such as:
Identifying problem areas: Power BI makes it easy to spot deviations from expected performance levels. Color-coded visuals highlight zones that need attention, enabling you to focus your efforts where they are needed most. Once problem areas have been identified, you can analyze related data to determine the root cause.
Data-driven decision-making: With an accurate view of current operations, you can make better decisions about how to optimize your production workflows. Power BI provides historical data, trends, and predictive insights to help you evaluate the impact of proposed changes before implementing them. Re-balancing assembly lines will significantly improve productivity or outsourcing a process step will reduce costs without compromising quality.
Continuous improvement: The analytics and reporting capabilities of Power BI support ongoing efforts to streamline processes and eliminate waste. As you make improvements, you can closely monitor their effects to ensure targets are met and make further refinements as needed. Over time, data-driven optimizations will transform your manufacturing operations, enabling substantial gains in efficiency, quality, and profitability.
With Power BI, you have the insights to turn your vision of a smarter factory into reality.
How to optimize production workflows with Power BI
Analyze production data
To optimize your production workflows, you must first understand your current processes. Power BI allows you to connect all your manufacturing data sources, including ERP, MES, and IoT (Internet of Things) systems. Visualize key performance indicators like cycle times, throughput, scrap rates, and resource utilization. Look for trends, anomalies, and areas of waste. The insights gained will highlight opportunities for improvement.
Identify bottlenecks
Power BI’s interactive visuals make it easy to spot bottlenecks, slowing down your production. Create process flow diagrams highlighting wait times, queue lengths, and constraint points. Analyze the root causes of delays to determine solutions, e.g., balancing assembly lines, improving material flow, or increasing capacity at constraint resources. Removing bottlenecks can significantly increase throughput and productivity.
Predictive capabilities
Power BI integrates with Azure Machine Learning to provide predictive analytics. Use your historical data to forecast key metrics like demand, cycle times, and quality. Predict potential disruptions to your production schedule and proactively take corrective actions. Simulate the impact of changes to your processes before implementation. Predictive analytics enables data-driven decisions and a lean, responsive manufacturing environment.
Monitor KPIs (Key Performance Indicators)
To sustain optimization, regularly monitor your key performance indicators in Power BI. Look for new areas of waste and inefficiency to address. Set targets and key performance indicators to drive ongoing progress. Provide interactive dashboards and reports to all levels of your organization, putting data in the hands of those closest to the work. A culture of continuous data-driven improvement will make your manufacturing processes increasingly agile, productive, and cost-effective over time.
Power BI in manufacturing FAQs
Q.1 What is Power BI?
Ans. Power BI is a business intelligence tool from Microsoft that provides interactive data visualization and analytics. It lets you consolidate your data from multiple sources, analyze it, gain insights, and share reports and dashboards. For manufacturers, Power BI can help optimize production by providing a sole source of truth for analyzing operations data.
Q.2 How can Power BI benefit manufacturing?
Ans. Power BI gives manufacturers real-time visibility into their production processes. By connecting data from sources like SQL databases, Excel files, and IoT sensors, Power BI creates an integrated view of operations. You can track KPIs, identify bottlenecks, and uncover hidden trends affecting productivity. With data-driven insights, you can streamline workflows, reduce waste, improve quality, and increase output.
Q.3 What types of data can Power BI analyze?
Ans. Power BI connects to a wide range of data sources relevant to manufacturing like:
Production schedules and work orders
Machine and sensor data
Quality test results
Inventory levels
Supply chain data
ERP and MES data
By combining data from across these systems, Power BI provides a holistic view of your manufacturing operations.
Q.4 How is Power BI deployed?
Ans. Power BI is a cloud-based service that lets you build and share analytics without needing to deploy any infrastructure. You simply connect your data sources, create reports and dashboards, and then share them with others in your organization. For manufacturers, this means you can get up and running with Power BI quickly without straining your IT resources. And since it is a subscription service, you only pay for what you need.
Power BI puts advanced analytics and data visualization capabilities in the hands of manufacturers to gain actionable insights, drive continuous improvement, and optimize productivity. By leveraging real-time data to understand and improve key processes, Power BI helps manufacturers achieve a competitive advantage through streamlined, data-driven operations.