You thought manufacturing medical devices was challenging enough with strict regulations and quality standards to uphold. Now you’re hearing about advanced statistical process control hereby “SPC” powered by data analytics and wondering how much more complicated things can get. Don’t panic. While traditional SPC has served you well, new data-driven methods are revolutionizing quality in healthcare manufacturing, providing real-time insights to help ensure optimal product performance and patient safety.
By leveraging predictive analytics, you’ll gain visibility into your processes, identifying issues before they arise and enabling continuous improvement. Quality redefined, meet your new best friend – data. If you’re ready to take quality to the next level, read on.
The Evolution of Quality in Healthcare Manufacturing
Quality in healthcare manufacturing has come a long way since the early days of “eyeballing it.” As processes became more complex, manufacturers implemented basic quality control using tools like control charts to monitor process stability and catch errors. This represented Quality 1.0.
Quality 2.0 emerged with the advancement of statistical process control (SPC) techniques. Methods like CPK and PPK ensured processes were not just stable but also capable of meeting specifications. Quality departments scrutinized processes to root out assignable causes of variation. While effective, SPC requires tedious manual data collection and charting.
Today, we’ve entered the era of Quality 3.0, fueled by data analytics and statistical learning. High-tech systems can automatically collect and analyze manufacturing data in real-time. Complex algorithms detect even subtle process changes to trigger instant corrective actions. Predictive models anticipate quality excursions before they happen. Fancy charts? Who needs them?
- Real-time monitoring. Sensor data streams provide live feedback on critical quality parameters. Automated alerts flag any readings that fall outside of control limits.
- Anomaly detection. Machine learning models establish normal operating patterns to spot anomalies, like tool wear, instantly. No more waiting for the next process capability study!
- Predictive analytics. By analyzing relationships between process inputs, environmental factors, and product quality, predictive models can calculate the probability of defects for any batch. Manufacturers get an early warning to adjust the process.
While the technologies powering Quality 3.0 are cutting-edge, the goal remains unchanged: patient safety through high-quality medical products. By harnessing data and analytics, modern quality systems are achieving this goal with a level of speed, precision, and efficiency that would astonish quality pioneers from decades past.
Understanding Statistical Process Control (SPC)
Statistical process control (SPC) uses data and statistical methods to gain insights into the quality and consistency of manufacturing processes. Rather than relying on end-product inspection alone, SPC monitors the process itself to detect variations before they result in defects.
Charts and Samples and Standards
The core tools of SPC are control charts, which plot data from samples over time. Control limits on the charts represent the expected variation in the process when it’s running “in control.” Points outside these limits suggest the process may be going out of whack and corrective action could be needed.
SPC relies on careful sampling. You can’t monitor every single widget, so samples provide a window into the overall process. The key is determining the right sample size and frequency to detect issues quickly without overburdening resources.
Standards are also critical for comparison. Process standards define what “in control” looks like based on factors like historical performance, product specifications, and customer requirements. By benchmarking against standards, SPC can detect drift and act before the process produces out-of-spec product.
Analytics: The Icing on the Control Chart
Today, advanced analytics amplifies the power of traditional SPC. Automated charting tools can generate control charts on demand for any process parameter. Multivariate charts can monitor interactions between multiple variables simultaneously. Predictive algorithms can detect patterns signaling an increased risk of quality issues—before points even hit control limits.
Analytics also enables real-time monitoring and alerting. Cloud-based SPC platforms give manufacturers 24/7 visibility into quality from anywhere. When the system detects an anomaly, it can immediately notify the relevant people to investigate and take corrective action promptly. No more waiting until the next day to discover a process went berserk overnight!
While SPC has been used for decades, the latest technological capabilities take quality control to the next level. By leveraging data and analytics, manufacturers gain unprecedented insights to optimize processes, reduce variability, and ensure the consistent quality of products that people depend on every day. What was once reactive becomes proactively predictive.
Advanced SPC Techniques for Quality Assurance
Advanced statistical process control (SPC) techniques are crucial for ensuring high quality in healthcare manufacturing. Rather than relying on outdated methods of end-product testing alone, SPC monitors your process in real time to detect issues early. By identifying and fixing problems at the source, you’ll experience fewer recalls, reduce waste, and boost customer satisfaction.
Real-Time Monitoring
SPC tracks critical quality attributes (CQAs) and key process parameters (KPPs) as products are made. Statistical algorithms analyze this data on the fly to spot anomalies signaling potential quality risks. The moment a red flag pops up, your team can investigate and make corrections to get back on track. No more waiting until the final inspection to discover you produced an entire batch out of spec! Continuous monitoring gives visibility into what’s happening on your production floor.
Data-Driven Insights
With SPC, you’re not just collecting data, you’re uncovering insights to optimize quality. Advanced analytics tools comb through historical records to detect patterns in how process inputs impact outputs. Using techniques like correlation analysis and principal component analysis (PCA), you can identify which factors have the greatest influence on your CQAs. Adjusting these inputs even slightly may significantly improve product consistency and reduce variability. Talk about a competitive advantage!
Automated Alerts
Wouldn’t you love a 24/7 watchdog monitoring your manufacturing processes? SPC software can trigger automatic alerts when it detects meaningful changes to keep you informed in real-time. You set control limits based on your product specifications, and the system notifies you immediately if a process strays outside these bounds. With automated alerts, there’s no need to review charts and crunch calculations manually. The software does the work for you so you can focus on what really matters: making high-quality medical products.
While end-product testing still has an important role, SPC provides the real-time insights needed to achieve true quality by design in healthcare manufacturing. By tapping into the power of data, you’ll redefine what quality means for your organization. Advanced analytics can help bring your processes under control and put you on the path to operational excellence.
Integrating Data Analytics Into SPC
Integrating data analytics into your SPC program allows for live monitoring and predictive insights into the consistency and quality of your manufacturing processes. Rather than reacting to issues after the fact, advanced statistical methods powered by big data can help spot trends and anomalies to prevent problems before they even arise.
As an example, by analyzing historical data from sensors, lab tests, and process parameters, machine learning algorithms can establish a “normal” range of expected variability. Then, by constantly monitoring live data streams, the system can detect when a process starts to deviate from this norm and trigger an alert. This allows quality engineers to investigate and make corrections before the spec limits are exceeded and product quality is impacted.
Some of the data analytics techniques that can enhance SPC include:
- Multivariate analysis: Looking at the relationships between multiple variables (e.g. temperature, pressure, vibration) to spot interactions that influence quality. Correlations that wouldn’t be detected using single-variable control charts.
- Predictive modeling: Using historical data to build a model that forecasts expected values for key metrics. Significant deviations from the predictions can signal a need for adjustment before problems arise.
- Pattern recognition: Detecting complex patterns in large datasets that could represent quality risks. Recognizing sequences of events or other “signatures” that lead to issues.
By integrating data analytics into your SPC program, you gain a “quality crystal ball” providing insights into the future performance of your processes. Rather than a reactive approach to responding to issues after the fact, advanced SPC techniques allow you to take a proactive stance—anticipating and avoiding problems before they ever impact your products or customers.
Real-Time Data for Process Monitoring
Real-time data is crucial for monitoring processes and detecting issues quickly. Rather than waiting until the end of a production run to analyze quality metrics, advanced SPC techniques provide live data streams and alerts to keep your fingers on the pulse of operations.
- Continuous data collection from networked sensors, instruments, and systems provides up-to-the-second information on factors like temperature, pressure, vibration, and flow rates. Like a well-trained pit crew, data analytics tools can monitor multiple data streams at once to detect even subtle changes that could impact product quality.
- Real-time SPC charts instantly plot data and trigger alerts if a process goes out of control. No more sifting through reams of paper records to pinpoint when an issue first arose. With a quick glance at a control chart on a dashboard, you’ll know right away if a correction needs to be made.
- Automated alerts can be set up to notify the appropriate staff as soon as an SPC rule has been violated, like a data point beyond control limits. Early notification of potential problems helps minimize downtime, reduce waste, and prevent subpar products from continuing through the process.
Staying on Track with Real-Time Reporting
Live reporting options let you monitor quality metrics from anywhere, keeping you up to speed on operations even when you can’t be on the plant floor. Many systems offer real-time dashboards that provide an at-a-glance overview of SPC and process data on desktops, tablets, or smartphones. Others can generate and distribute live reports on a set schedule to keep stakeholders informed of quality performance and metrics.
Like a championship race car, high-tech manufacturing demands precision and performance. Real-time data analytics puts you in the driver’s seat, ready to make adjustments at a moment’s notice and keep your processes running at peak efficiency. Staying on top of quality in real-time ultimately results in higher productivity, reduced risk, and a competitive edge.
Identifying Sources of Variation with Multivariate Analysis
So, you’ve got a handle on monitoring your process with control charts and identifying special cause variation, but now you want to dig deeper into the mysteries of your data. Multivariate analysis lets you explore interactions between multiple variables (factors) at once to uncover the hidden sources of variation messing with your quality.
Rather than looking at one variable at a time, multivariate methods consider how changes in one factor influence others. It’s like having a complex puzzle with lots of interlocking pieces—you need to step back and see how it all fits together. Some of the most useful techniques for manufacturing include:
- Principal component analysis (PCA): This helps identify which variables in your data set are the most important by grouping strongly correlated factors. It can reveal if you’re measuring more variables than impact your product quality, allowing you to streamline your data collection and focus monitoring efforts on what really matters.
- Partial least squares (PLS): Like PCA, this data reduction method finds the factors with the greatest influence on your key output variable (like a critical quality metric). However, it goes a step further by developing a predictive model to show how changes in input variables directly impact the output. This gives you valuable insight into the levers you can pull to optimize quality.
- Discriminant analysis: If you want to determine which variables are the best predictors of different quality “classes” (like pass/fail or grades), discriminant analysis is your friend. It will identify the key drivers that separate good products from bad products, so you know where to make improvements.
By tapping into the power of multivariate data analysis, you open up a whole new world of understanding about what’s really driving quality in your process. Rather than playing whack-a-mole with one variable at a time, you can get to the root cause of variation and take your quality capabilities to the next level.
Advanced Control Charts for Enhanced Detection
Advanced control charts are the superheroes of statistical process control, swooping in to detect issues traditional control charts miss. They utilize complex algorithms to monitor your process data for anomalies regular charts can’t spot. Think of them as control charts on steroids. Some of them include:
CUSUM Charts
The Cumulative Sum (CUSUM) chart detects small shifts in the process that standard charts would usually ignore. It plots the cumulative sum of deviations from a target, allowing it to detect drifts and jumps traditional charts can’t. CUSUM charts are ideal for processes where even small changes can impact quality.

EWMA Charts
Exponentially Weighted Moving Average (EWMA) charts place a higher weight on recent data points, making them more sensitive to recent changes in a process. They detect moderate shifts in the process mean faster than standard charts. EWMA charts are useful when monitoring processes where conditions change gradually over time.
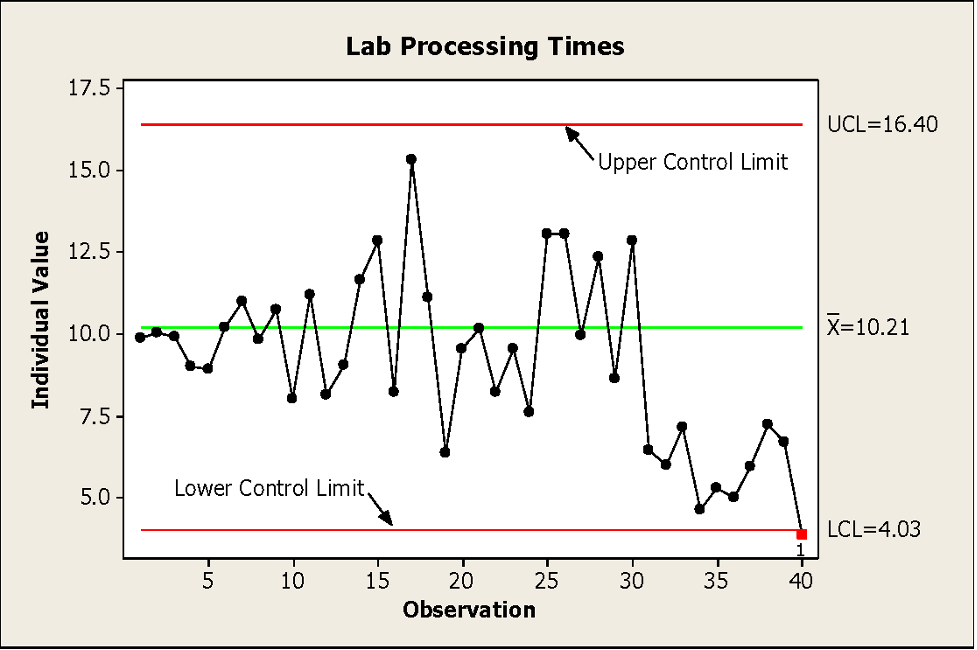
Real-Time Charts
Advanced control charts shine when used for real-time monitoring powered by analytics. They can analyze streaming process data to detect issues as they happen, rather than after the fact. Real-time SPC enables corrective action to be taken immediately, reducing waste and the risk of nonconforming products. Some charting software can even automatically stop processes when an out-of-control condition is detected to avoid producing defective products.
While advanced control charts require more complex calculations, analytics and statistical software have made them accessible to the average quality professional. They provide an enhanced level of detection, enabling you to redefine what “in control” means for your process. So why rely on standard control charts when you have these super-powered alternatives protecting your products?
Automated SPC Systems for Efficiency
These days, you don’t have time to manually monitor your manufacturing processes. You’ve got a business to run! That’s where automated statistical process control (SPC) comes in. Automated SPC systems leverage data analytics and statistical methods to keep an eagle eye on your operations 24/7.
Early warning system
By analyzing historical data, automated SPC systems establish control limits for your key process indicators. If readings go above or below these limits, the system triggers an alarm. This acts as an early warning system, notifying you at the first sign of trouble so you can determine the root cause and prevent more substantial issues down the line.
Insights into causation
The data and analytics powering automated SPC systems don’t just tell you what’s going wrong, but why. They can detect correlations between multiple parameters to determine the factors influencing your quality metrics. For example, the system may find a link between temperature fluctuations, batch materials, and higher rejection rates. These causal insights allow you to make data-driven decisions on corrective and preventive actions
Continuous optimization
Automated SPC and data analytics enable continuous improvement to reach the pinnacle of quality and efficiency. The systems generate performance reports with metrics, trends, and insights on your manufacturing processes over time. By monitoring how key indicators change in response to the actions you take, you can determine what’s working and make ongoing tweaks to optimize quality, productivity, and cost-effectiveness.
In summary, automated SPC and data analytics redefine quality in healthcare manufacturing.
The Future of Quality: AI and Predictive Analytics for SPC
The future of quality in healthcare manufacturing is predictive and proactive, not reactive. Artificial intelligence and advanced analytics are enabling real-time monitoring and predictive insights into processes and product quality. Rather than waiting for defects to emerge, these techniques identify patterns that presage issues before they arise.
As more data becomes available from connected equipment and systems, machine learning algorithms can detect subtle changes that signal a process is drifting out of control. Anomaly detection spots unusual patterns that differ from the norm, even in a sea of data. This allows you to take corrective action before a nonconforming product is produced.
Imagine being able to predict and avoid quality excursions and recalls. Data-driven predictive quality leverages the power of AI and analytics to understand process capability and performance in new ways. By uncovering hidden relationships and interactions in manufacturing data, these methods identify the key drivers of quality and optimize processes autonomously.
Augmented SPC incorporates big data and predictive modeling to enhance statistical process control. Rather than relying on lagging quality indicators, you can tap into leading indicators to foresee and remedy issues proactively. Digital twins of processes and products enable virtual monitoring and experimentation to optimize quality without disrupting physical operations. This speeds up continuous improvement and reduces waste.
While sky-high expectations around AI and big data abound, focusing predictive power on improving and assuring quality in healthcare manufacturing may be its killer app. The future is here—it’s just not evenly distributed yet. Advanced analytics and predictive quality are ushering in a new era where high-quality, life-saving products are made right the first time. The robots are ready to help—if we have the data and willingness to let them.
Final Thoughts
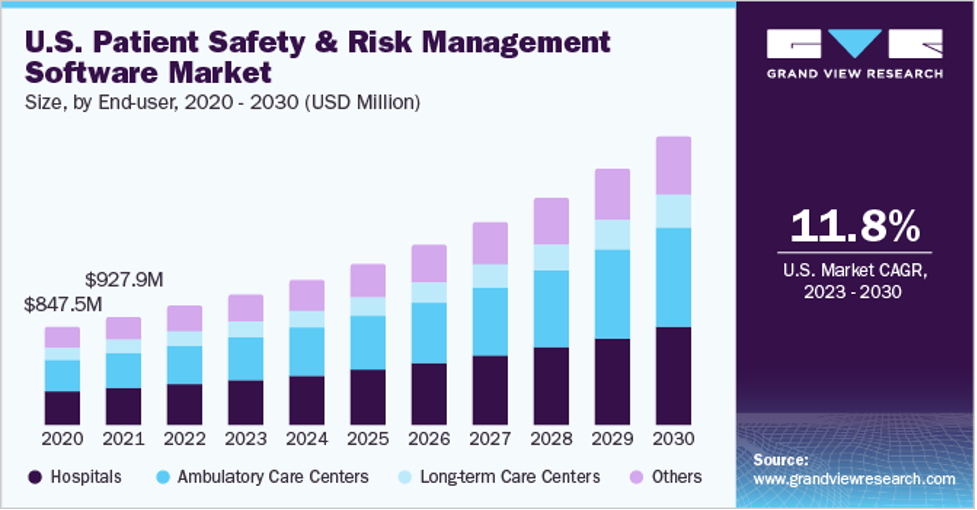
The global patient safety and risk management software market size was valued at USD 1.77 billion in 2022 and is anticipated to grow at a compound annual growth rate (CAGR) of 12.2% from 2023 to 2030.The healthcare manufacturing industry is witnessing a transformative shift from traditional methods to Advanced SPC Techniques and Data Analytics. Quality 3.0, driven by real-time monitoring and predictive analytics, is revolutionizing the way we ensure optimal product performance and patient safety.
Subscribe to my LinkedIn newsletter for exclusive insights into the evolving landscape of healthcare manufacturing. Stay ahead with the latest on Patient Safety. Subscribe now to be part of the community shaping the next era of high-quality, innovative products. Don’t miss out on the conversation – stay informed and connected by subscribing today!
#HealthcareManufacturing #QualityAssurance #DataAnalytics #Innovation #SubscribeNow #patientsafety

Empowering Healthcare & Smart Manufacturing CXOs | Transforming Challenges into Growth Opportunities with Data-Driven AI Innovation | Microsoft Gold Partner with 30+ years in Data and AI Strategy | #Inc5000 Honoree